We have prepared a demo database, with some master data examples and randomly generated inspections data. Purpose is to demonstrate QTrendControl features and capabilities. Note that you can both view and edit data, so be free to experiment and play with application! Fast internet connection is prerequisite.
You can access demo connections through following links:
Demo 1 database user: demo_user1, password: demo
Demo 2 database user: demo_user2, password: demo
Demo 3 database user: demo_user3, password: demo
Demo 4 database user: demo_user4, password: demo
Demo 5 database user: demo_user5, password: demo
Demo 6 database user: demo_user6, password: demo
Demo 7 database user: demo_user7, password: demo
Demo 8 database user: demo_user8, password: demo
Demo 9 database user: demo_user9, password: demo
Demo 10 database user: demo_user10, password: demo
When you click on some of the links above, a remote desktop connection will be opened in new window. If QTrendControl frontend application has been previously closed, system will automatically start application and you will be prompted to enter database username and password (user: demo_userX, password: demo). If application has been left opened by previous session, then there will be no login form, but application will be already opened with a user logged in.


If somebody else is already connected to the same demo instance, you will be notified that you cannot open front-end application because file is already in use, and then system will terminate your remote desktop session. There are multiple demo instances provided (see links above), so you can try another link.

You will notice that there are multiple departments and plants defined in organization structure. However, inspection points are defined and demo inspections data is randomly generated only for two departments: PRODUCTION OF SEMI-SOLID AND LIQUID FORMS and HARD GELATINE CAPSULES PRODUCTION.
PRODUCTION OF SEMI-SOLID AND LIQUID FORMS is an example of variable data (continuous data) inspections, while HARD GELATINE CAPSULES PRODUCTION is an example of attribute data (discrete data), defects counting.


Consequently, when trying to create report, be aware that demo inspections data is entered (automatically randomly generated) only for these two departments (PRODUCTION OF SEMI-SOLID AND LIQUID FORMS and HARD GELATINE CAPSULES PRODUCTION), for time period between 1.1.2019 and 30.6.2019.
In reporting form, you can for example enter "1.1.2019." as start date and "31.1.2019." as end date. Note that date format is DD.MM.YYYY.


Then, on "selection criteria" tab select only PRODUCTION OF SEMI-SOLID AND LIQUID FORMS and HARD GELATINE CAPSULES PRODUCTION departments. You can also narrow down selection in other respective tabs (plants, areas, lines, devices, inspection types, inspection points etc.). The less the number of items is selected, the faster is report creation, off course.


When you finished selecting your selection criteria, click on one of the respective buttons for generating reports or reporting views:

Wait for few minutes (depending on how many items are selected and what is time period range). Typically, a report will be created in 1 to 3 minutes.
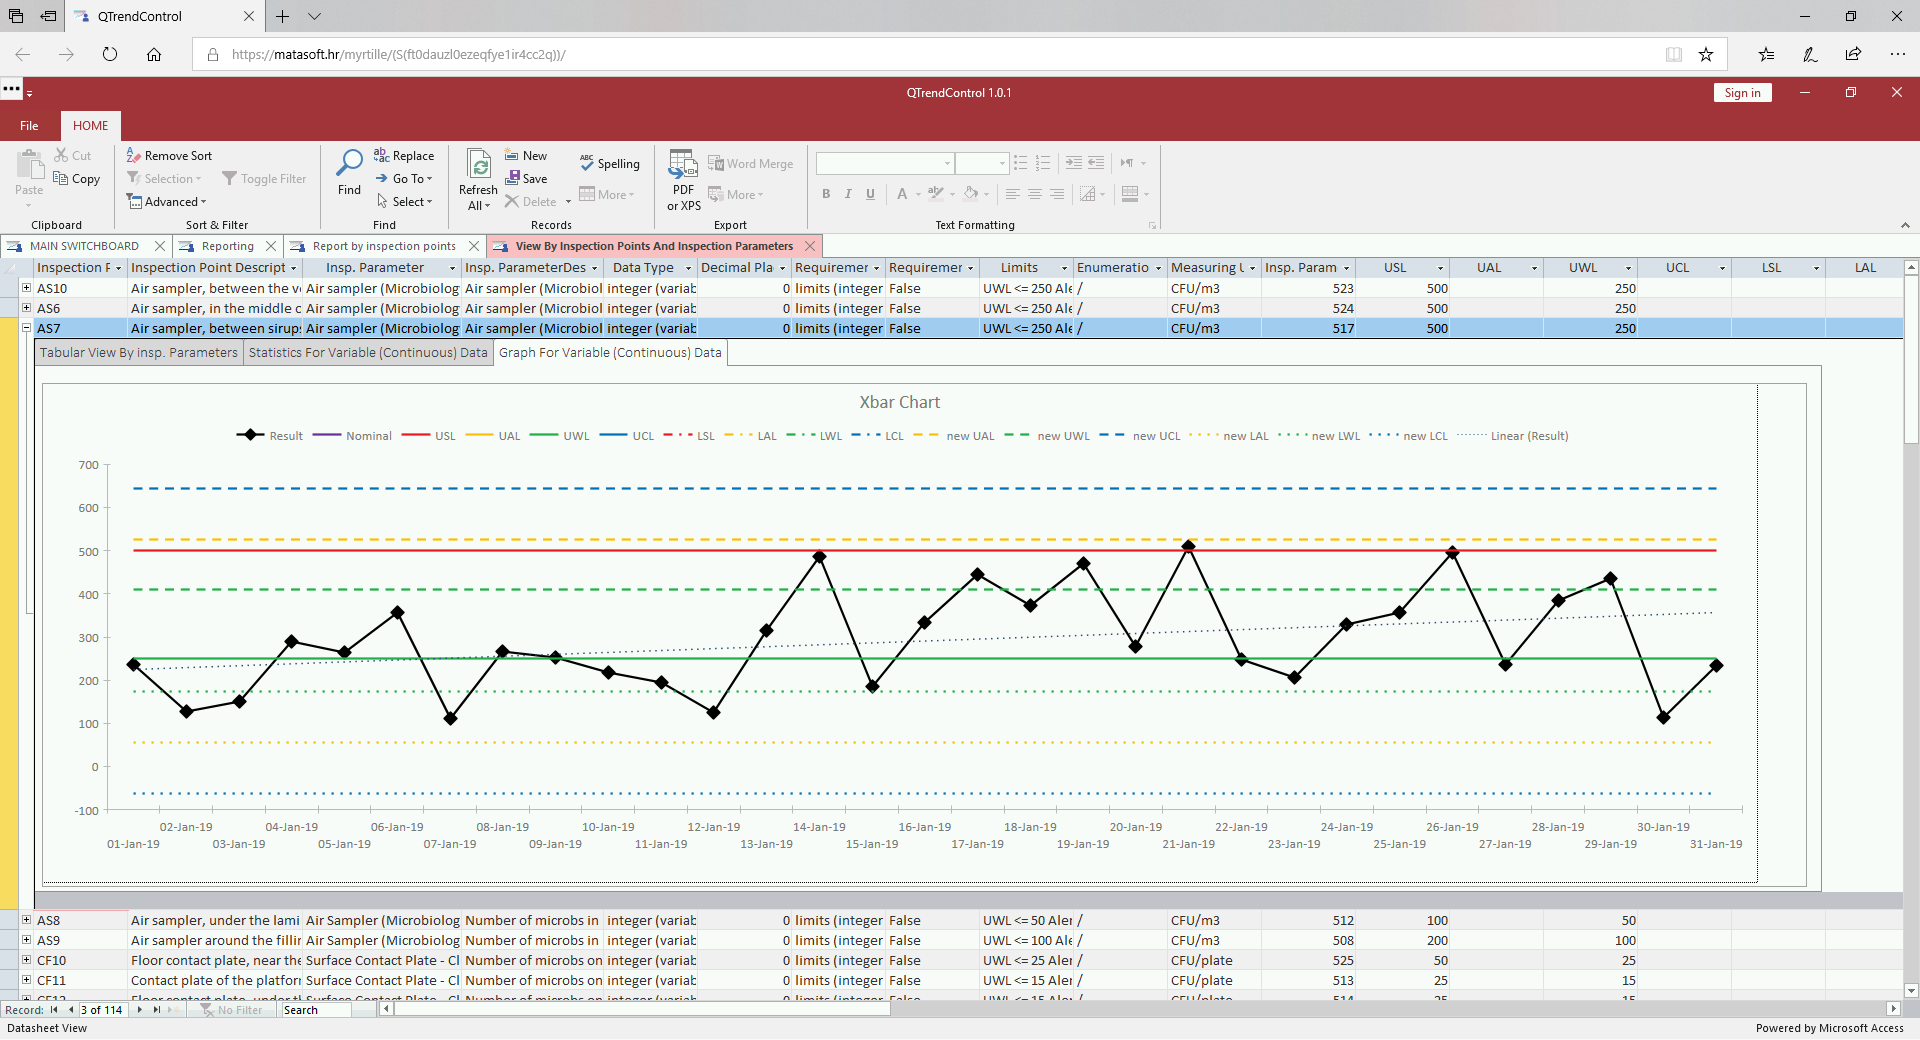
If, for instance, you wish to open form for browsing and viewing of inspection results, click on the button "Open View, By Inspection Points"


If you wish to create printable report, click on the button "Open Report, By Inspection Points".

You will get generated print preview of a report. This report can be then printed out into pdf locally, by using Myrtille PDF printer, which will open PDF report in your browser.


In order to print report on your local printer or save it into PDF document, you can use Myrtille PDF printer. Please, do not use embedded "PDF or XPS" button in the ribbon to export generated report into PDF, because it will save PDF document in local Documents folder, which is not accessible through your web browser session!
DO NOT USE  button in the ribbon!
Instead, go to the File option in the menu and then click on the "Print".

This will open Print dialog, in which choose "Myrtile PDF (redirected X)" printer and click "Ok". Leave option "Print to File" unchecked!

Click on button "Properties" and ensure that Color option is switched on and click OK.


When QTrendControl application finishes printing, wait a moment (approx. half a minute) and then a window with the generated PDF report will appear in your web browser.

Now you have various options to deal with the opened document, such as printing on a local printer or saving to a local PDF file.


Typically, you might choose to save it on your computer as PDF file:

Note that exact interface for saving and printig PDF report depends on your web browser and your system. The previous example was in Chrome browser. The same dialog in Edge browser looks a little bit different:

Discover More
Visit our website to learn more about QTrendControl and how it can transform your operations. Contact us to schedule a demo and see the difference for yourself.
#QTrendControl #DataDriven #IndustrialSoftware #TrendAnalysis #Monitoring #ProcessOptimization #QualityControl #PredictiveMaintenance #EnergyEfficiency #ProcessImprovement #ProcessCapability #ProcessPerformance #ProcessMonitoring #ProcessTrending
https://matasoft.hr/QTrendControl/index.php/qtrendcontrol-software
https://matasoft.hr/QTrendControl/index.php/qtrendcontrol-software/20-trendcontrol-software/features
https://matasoft.hr/QTrendControl/index.php/qtrendcontrol-software/introduction
https://matasoft.hr/QTrendControl/index.php/qtrendcontrol-software/system-architecture
https://matasoft.hr/QTrendControl/index.php/qtrendcontrol-software/master-data-management
https://matasoft.hr/QTrendControl/index.php/qtrendcontrol-software/inspection-data-input
https://matasoft.hr/QTrendControl/index.php/qtrendcontrol-software/inspection-results-reporting
https://matasoft.hr/QTrendControl/index.php/qtrendcontrol-software/qtrendcontrol-demo
https://matasoft.hr/QTrendControl/index.php/qdoe-design-of-experiments-software/about-qdoe-software
https://matasoft.hr/QTrendControl/index.php/qdoe-design-of-experiments-software/doe-case-studies