
Introduction
Process capability analysis is an important part of quality trending and continuous process improvement methodologies, used for assessing and improving process and product quality.
The goal of capability analysis is to ensure that a process is capable of meeting customer specifications, expressed by upper and lower specification limits (USL, LSL).
A set of capability and performance statistics (CPU, CPL, Cpk, PPU, PPL, Ppk) is used to quantify process capability and performance. However, practitioners are often confused how are they used and assessed and what is the difference between them, especially when first time introduced with those terms.
In this article we will explore process capability analysis methodology, trying to explain the difference between process capability and process performance and how to use related statistics to judge whether our process is capable to comply with customer expectations.
We will also demonstrate process capability and process performance on some example datasets, by using QTrendControl demo software, freely available on this link: https://matasoft.hr/QTrendControl/index.php/demo
Formulas and definition
Process capability analysis compares the distribution of sample values to the specification limits (USL, LSL), in order to determine how well a given process meets a set of specification limits. In other words, it measures how well a process performs.
Process capability indices are used to describe and quantify the capability of a process. Larger values of indices may be interpreted to indicate that a process is more capable of producing output within the specification limits. Following formulas are used:
PROCESS CAPABILITY(Short-term capability, "Within" capability, Potential capability) |
 |
|
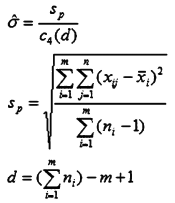
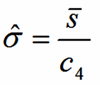
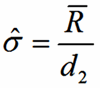
Sigma estimator (σ̂) can be estimated on several ways: 1. Pooled Standard DeviationUse when n > 2 2. Average of the Subgroup Standard DeviationsUse when n > 4
3. Average of the Subgroup RangesUse when n = 1 to 4
n = the subgroup size 4. Average of the Moving RangeThis formula is used in cases when we have no rational subgroups, but rather individual values representing each sample. The formula is the same as in the case of subgroup ranges, but average of the moving range is used instead of average of range. d2 constant is 1.1284, which is d2 chosen for subgroup size of 2. |
PROCESS PERFORMANCE(Long-term capability, "Overall" capability, Actual capability) |
 |
|
Standard deviation (σ) is calculated by this formula:
|

Cp and Pp are usually called "Capability ratio" and "Performance ratio".
Cpk and Ppk are usually called "Capability index" and "Performance index", although some people prefer terms "Centered capability ratio" and "Centered Performance Ratio" respectively.
It is important to mention that for calculation of process capability indices you have to assume stability of your process, i.e. that the process distribution is normal. For unstable processes process capability indices are meaningless.
Difference between process capability and process performance
As we can see, formulas for process capability and process performance are pretty much the same, differing only on how sigma (i.e. standard deviation) is estimated.
Process capability (i.e. short-term capability, "within" capability" is calculated using the so-called "WITHIN standard deviation", while process performance uses the so-called "OVERALL standard deviation".


If we have rational subgroups for sampling (such is the case with Shewhart X-bar / Range charts), then "Within" standard deviation is calculated either based on subgroup ranges or subgroup standard deviations.
In case of small subgroup sizes, the formula is based on calculation of ranges inside subgroups: σ(within) = Average(Range) / d2, where constant d2 is defined for each rational subgroup sample size. In case of bigger subgroup sizes, formula based on subgroup standard deviations is used: σ(within) = Average(s) / d2, where s denotes a subgroups standard deviation.
If there are no rational subgroups of samples, but rather each sampling is represented by one distinct value, then standard deviation is calculated by using moving range instead of range. The formula is: σ(within) = Average(Moving Range) / d2, where d2 constant for sample size of 2 is used and is d2=1.1284.
Overall standard deviation represents the variation of all the data and is calculated by using regular formula for standard deviation, on all the samples.
Its is to be expected that short-term variability inside a subgroup is smaller than long-term variability between subgroups, thus overall standard deviation is typically bigger than the within standard deviation and consequently process capability (Cpk) is bigger than the process performance (Ppk). However, It is also possible to get a Ppk that is larger than Cpk, especially with a subgroup size of 1 (when no rational subgroups are used). In perfectly capable process, process capability index and process performance index would have same value.
Process Capability (Cpk) only accounts for the variation within the subgroups. It does not account for the shift and drift between subgroups. Therefore, It is sometimes referred to as the "potential capability" because it represents the potential your process has at producing within specification limits, presuming there is no substantial variation between subgroups over time.
Process Performance (Ppk) accounts for the overall variation of all measurements taken during a longer time period. Theoretically it includes both the variation within subgroups and also the shift and drift between them.
Process Capability
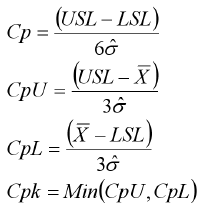
Process capability is also often called "short-term capability, "within capability" or "potential" capability. Process capability indices used are the following:
Cp= (USL-LSL)/6σ (within)
Cpu = (USL-Mean)/3σ (within)
Cpl= (Mean-Cpl)/3σ (within)
Cpk = min (Cpu, Cpl)
While we talk about σ within, it reflects the Rbar/d2, mRbar/d2 or Sbar/C4.
σ(within) = Rbar/d2 is used for data if we see the average of the ranges of the subgroups and when we have a small subgroup size, whereas, σ(within) = Sbar/C4 is used for the data points when we have big subgroup size. d2 and c4 are the predefined control charts constants, as per the subgroup size we have taken. In case when there are no rational subgroups, moving range is used instead of range, σ(within) = mRbar/d2.
Cp (or CP) stands for "process capability", and is a simple measure of the capability of a process. The narrower the spread of a systems output is, the greater the Cp value. It tells us how much potentially the system could meet specification limits if process mean is well adjusted to follow target value in the middle between upper and lower limit. Since CP is only focusing on the data spread, while ignoring the averages (central tendency), we might get wrong conclusions whether the process comply to specification. Even if the CP has a high value, it does not necessary mean that the process is complying to the specification, because central tendency might be leaning towards upper or lower limits instead of being centered to desired middle ground (target value).
Cpk (or CPK) stands for "process capability index" and refers to the capability a particular process has of achieving output within certain specifications. If Cpk is more than 1, the system has the potential to perform as well as required.
While Cp talks only about the data spread and width of the data range, the Cpk talks also about the central tendency, whether the process mean is well centered in between upper and lower specification limit. Though both give the process capability estimate, Cpk gives a more precise information about process capability. The larger the difference between Cpk and Cp, the more off-center your process is.
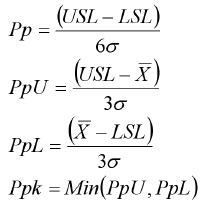
Process Performance
Process performance is also often called "long-term capability, "overall capability" or "actual" capability. Process performance indices used are the following:
Pp =(USL-LSL)/6σ (overall)
Ppu = (USL-Mean)/3σ (overall)
Ppl= (Mean-Cpl)/3σ (overall)
Ppk = min (Ppu, Ppl)
Sigma is here calculated by using regular formula for standard deviation, σ(overall) = Sqrt (∑(x-xbar)^2/(n-1)), where xbar refers to the process mean of the individual data points x, where n indicates sample size and their degree of freedom reflects as n-1.
The Pp and Ppk provide the overall process capability overview or long-term process capability.
Pp (or Pp) stands for "process performance". It is much the same as Cp, but unlike Cp it measures actual performance rather than potential. Like Cp, it measures spread, and is subject to the same weaknesses as Cp.
Ppk (or PPK) stands for "process performance index". Like Pp, it measures actual performance rather than potential. Smaller Ppk values indicate the deviation from specification is larger. Larger Ppk values indicate the deviation from specification is smaller.
Difference Between Cpk and Ppk
Cpk talks only about the common cause variation or short-term process within the subgroups. The Ppk, on the other hand, calculates for all common cause and special cause, over the longer time period.
We can say that Cpk talks about the potential of the process capability, whereas Ppk provides the actual process capability status over the time period.
Process Sigma Level
Another way to express process capability is so-called "Sigma Level", which is mutually interchangeable with Cpk (or Ppk). Sigma Level (or Process Sigma Level) is Cpk (or Ppk) multiplied by 3.
| Two sided table | |||
| Cpk | Sigma level | % out of tolerance | PPM out of tolerance |
| 0.33 | 1.0 | 31.73 | 317310.508 |
| 0.50 | 1.5 | 13.36 | 133614.403 |
| 0.67 | 2.0 | 4.55 | 45500.264 |
| 0.83 | 2.5 | 1.24 | 12419.331 |
| 1.00 | 3.0 | 0.27 | 2699.796 |
| 1.17 | 3.5 | 0.05 | 465.258 |
| 1.33 | 4.0 | 0.01 | 63.342 |
| 1.50 | 4.5 | 0.001 | 6.795 |
| 1.67 | 5.0 | 0.0001 | 0.573 |
| 1.83 | 5.5 | 0.000004 | 0.038 |
| 2.00 | 6.0 | 0.0000002 | 0.002 |

Evaluating capability and performance indices
As we can see from the previous table, an organization has to set a goal to be achieved, i.e. to define which level of quality is desired or acceptable. This goal can be expressed in terms of process sigma level or in terms of Cpk/Ppk.
Typically, it is considered that Cpk and Ppk should be greater than 1.33 (sigma level 4) in order to declare a process to be "good" or "capable".
Examples of process capability and process performance analysis
QTrendControl demo application
We can access free QTrendControl demo appllication on this link: https://matasoft.hr/QTrendControl/index.php/demo


We will create datasheet view for SIRUPS production plant, for time period between 1.1.2019 and 31.3.2019.

Example of capable process
Now, let's see the data for inspection parameter S333, which is a microbiological swab of a colloid mill inner surface.
Scrolling through the tabular data and looking into chart, we can see that all data comply to specification limit (only USL is defined), although 3 data points violated warning limit (UWL).


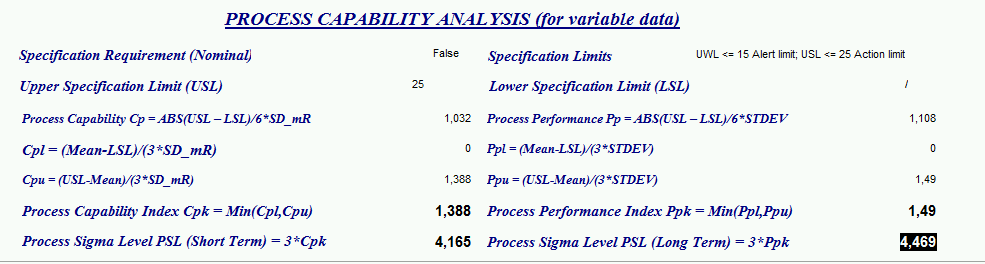
Now, let's see statistics.


O.K., let's analyse statistical results, step by step.
First, notice how short-term standard deviation (SD_mR, based on moving range) and long-term standard deviation slightly differ.

Next, we can see that the underlying data distribution is NORMAL, meaning that the process is under statistical control. Therefore, we can expect to have meaningful capability analysis.

Also, notice that the system concluded that we have one outlier from normal distribution.

Finally, there is capability analysis, from which we can see that both Cpk and Ppk are greater than 1.33, meaning that the process is capable in both short-term and long-term. We are capable to maintain microbiological cleanliness inside the colloid mill inside specification limits, in this particular case, it means below upper specification limit (USL).

Example of non-capable process
Let's now examine inspection parameter P26, which is measuring of number of airborne particles in a clean-room production area.


From chart and tabular datasheet, we can immediately notice that here we have 4 violations of upper specification limit. Let's see statistics.


Again, we can see that the sample standard deviation and standard deviation estimate based on moving average slightly differ.

Again, distribution is normal, meaning that the process is under statistical control, allowing us to have meaningful capability analysis.

Though the system concluded that the distribution is more or less normal, there are four outliers present, which are data points violating USL.

Finally, if we look into capability analysis, we can see that both Cpk and Ppk are far below 1.0, meaning that this process is bad and not capable to comply to specification limits (in this case USL)! We are not able to maintain airborne particles below specification limits! This conclusion urges to take some corrective measures, such as investing into new HVAC system in order to ensure proper air filtration.

Conclusion
Process capability analysis is a useful tool for assessing whether our process is capable to satisfy customer expectations and internal specifications.
Process capability analysis provides two sets of indices. One is related to short-term process capability, which gives us Cpk index, telling us whether process is potentially capable to meet specification. Another set of indices is related to long-term process performance, providing Ppk index, which tell us whether our process actually meets specification in longer period of time.
Discover More
Visit our website to learn more about QTrendControl and how it can transform your operations. Contact us to schedule a demo and see the difference for yourself.
#QTrendControl #DataDriven #IndustrialSoftware #TrendAnalysis #Monitoring #ProcessOptimization #QualityControl #PredictiveMaintenance #EnergyEfficiency #ProcessImprovement #ProcessCapability #ProcessPerformance #ProcessMonitoring #ProcessTrending
https://matasoft.hr/QTrendControl/index.php/qtrendcontrol-software
https://matasoft.hr/QTrendControl/index.php/qtrendcontrol-software/20-trendcontrol-software/features
https://matasoft.hr/QTrendControl/index.php/qtrendcontrol-software/introduction
https://matasoft.hr/QTrendControl/index.php/qtrendcontrol-software/system-architecture
https://matasoft.hr/QTrendControl/index.php/qtrendcontrol-software/master-data-management
https://matasoft.hr/QTrendControl/index.php/qtrendcontrol-software/inspection-data-input
https://matasoft.hr/QTrendControl/index.php/qtrendcontrol-software/inspection-results-reporting
https://matasoft.hr/QTrendControl/index.php/qtrendcontrol-software/qtrendcontrol-demo
https://matasoft.hr/QTrendControl/index.php/qdoe-design-of-experiments-software/about-qdoe-software
https://matasoft.hr/QTrendControl/index.php/qdoe-design-of-experiments-software/doe-case-studies