Introduction
This article will demonstrate how QLazDOE software can manage simple comparative studies in which we want to determine whether two formulations of a product are equal or different in measured property.
Example used for this demonstration is from the book "Design and Analysis of Experiments" by Douglas C. Montgomery, which you can purchase from: https://www.wiley.com/en-hr/Design+and+Analysis+of+Experiments,+10th+Edition-p-9781119492443
Problem Statement
There are two formulations for a cement mortar. We want to determine whether two formulations behave the same in terms of tension bond strength of the mortar. The experimenter prepared 10 samples of the original formulation and 10 samples of the modified formulation.
We will refer to the two different formulations as two treatments or as two levels of the factor formulations. Since there are 10 measurements for each formulation, we will consider experiment to be replicated, with 10 replicates.
Finally, we will compare the means using one-sided, two-sample t-test, in order to examine whether two formulations can be considered equal or different in respect to tension bond strength.
Definition of Factors and Levels
First we need to insert and define new DOE project, entering project name, description and problem statement.
Now we need to provide definition of factors and levels for this project. We will treat this problem as full-factorial experiment with one factor (formulation) having two different treatments i.e. two levels.
Click on the button or corresponding menu item "Create new Factors and Levels Definition File", for creating and opening new factors & levels definition file.
This action will create and open file for definition of factors and their levels, where we can enter and save our definition of one factor with two levels.
We can also click button or corresponding menu item "Determine Number of Factors and Levels", in order to get information about number of factors and levels into the project record.
Design of Experiments
First we need to create new solution for the current project.
There will be 10 measurements for each formulation, therefore we will define full factorial replicated experiment with 10 replicates.
Once we defined our solution and parameters for DOE generator, we can trigger generation of designed experiment. You can generate new experiment by clicking button or choosing corresponding action "Create DOE in one step" from the menu.
This action will create both DOE matrix file and corresponding DOE results file, ready for entering experimental results.
Experimental Results
Now we can enter experimental results. We will add new column "Tension Bond Strength", for entering response variable results, and enter the experimental data. Don't forget to save the spreadsheet!
Analysis of Experimental Results
For analysis of experimental results we will use integrated LazStats statistical software to perform one-sided, two-sample t-test.
FIrst we need to open results in the LazStats software, by clicking button or by choosing corresponding action "Analyze DOE Results in LazStats" from the menu.
This action will open LazStats with loaded results. Now we need to find t-test function in the LazStats menu. Go to Analyses/Comparisons/t-tests.
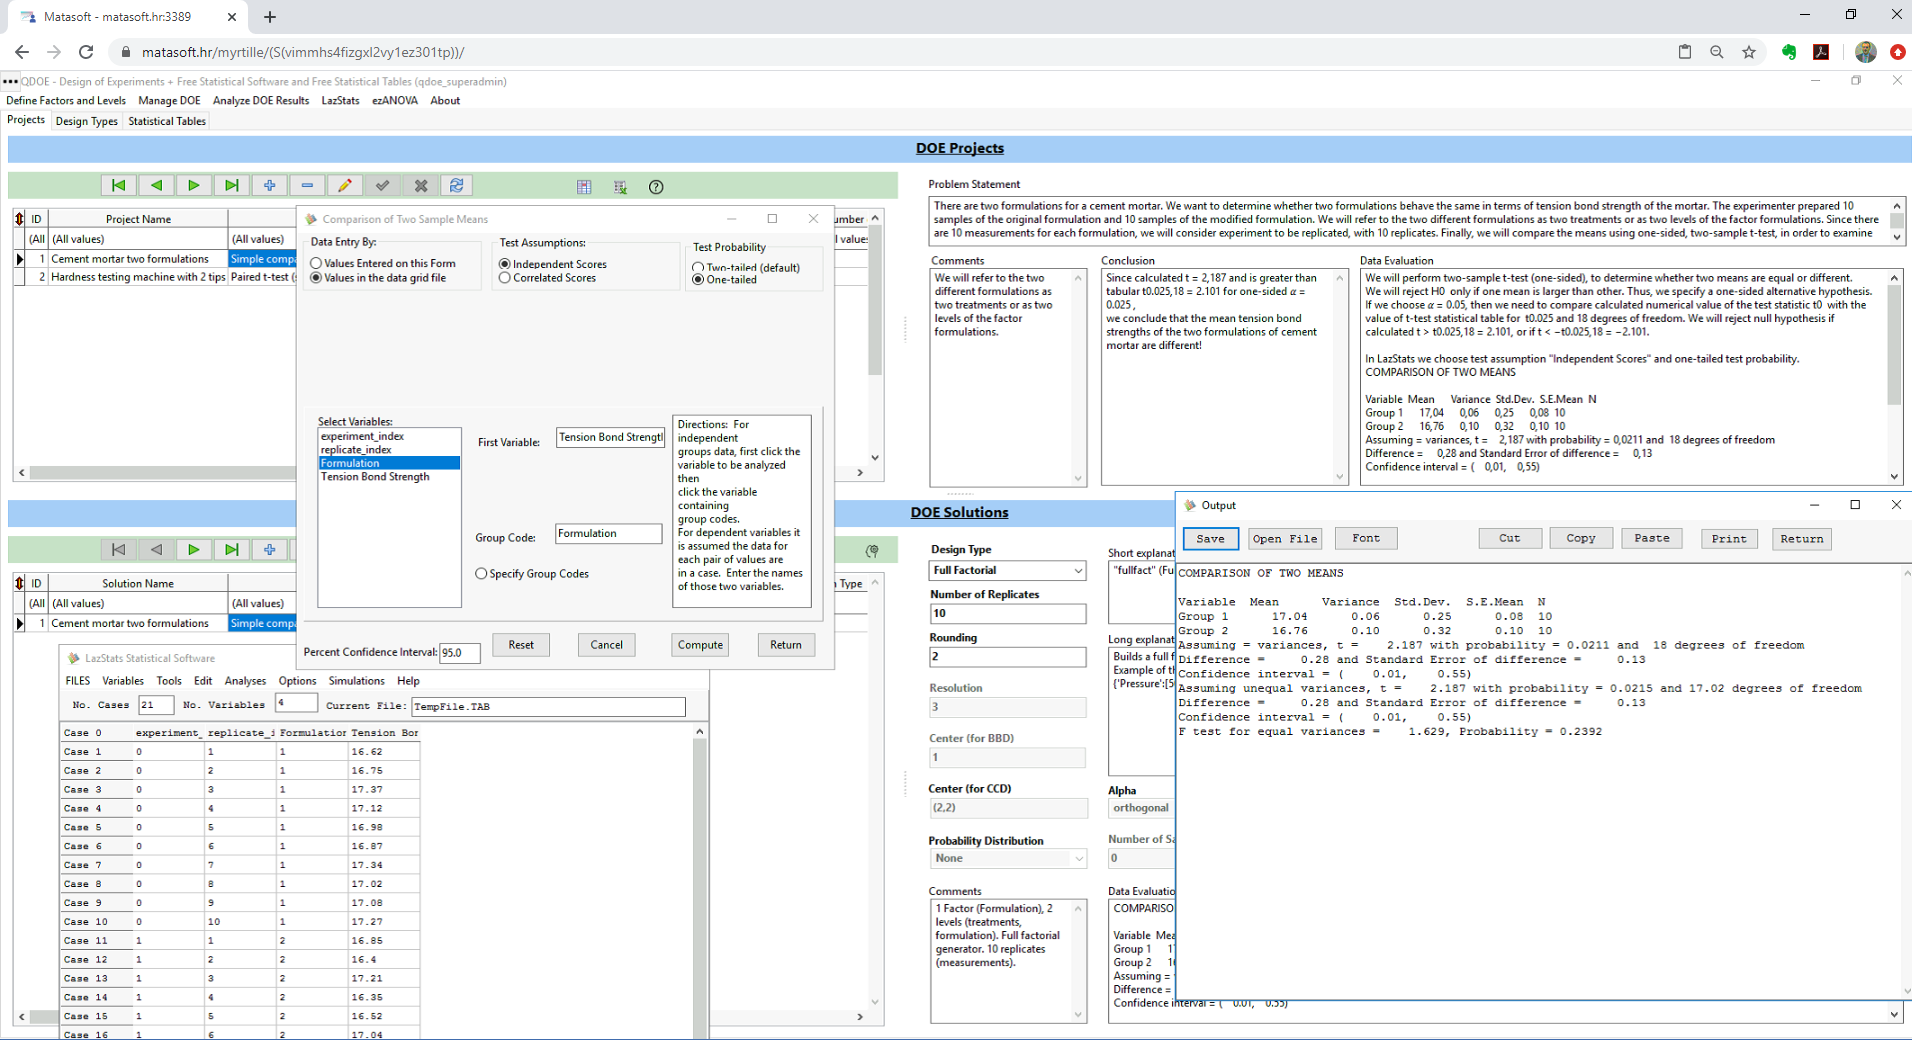
"Comparison of Two Sample Means" form opens.
Now, we have to choose options as follows:
- Data Entry By: "Values in the data grid file"
- Test Assumptions: "Independent Scores"
- Test probability: "One-tailed"
For the "First Variable" value, select "Tension Bond Strength" response variable. For the "Group Code" value, select "Formulation" input variable.
Click the "Compute" button to get results from LazStats.
LazStats returned following computation for the t-test:
COMPARISON OF TWO MEANS
Variable Mean Variance Std.Dev. S.E.Mean N
Group 1 17.04 0.06 0.25 0.08 10
Group 2 16.76 0.10 0.32 0.10 10
Assuming = variances, t = 2.187 with probability = 0.0211 and 18 degrees of freedom
Difference = 0.28 and Standard Error of difference = 0.13
Confidence interval = ( 0.01, 0.55)
Assuming unequal variances, t = 2.187 with probability = 0.0215 and 17.02 degrees of freedom
Difference = 0.28 and Standard Error of difference = 0.13
Confidence interval = ( 0.01, 0.55)
F test for equal variances = 1.629, Probability = 0.2392
So, we got t-test statistics value t = 2.187, with 18 degrees of freedom.
Now we need to compare this value with the tabular critical values for t-test, in order to drive our conclusion.
In QLazDOE software go to the "Statistical Tables" tab and choose "T Distribution" sub-tab.
We will reject H0 only if one mean is larger than other. Thus, we specify a one-sided alternative hypothesis.
If we choose alpha = 0.05, then we need to compare calculated numerical value of the test statistic t with the value of t-test statistical table for t0.025 and 18 degrees of freedom. We will reject null hypothesis if calculated t > t0.025,18 = 2.101, or if t < −t0.025,18 = −2.101.
Calculated t = 2,187 and is greater than t0.025,18 = 2.101. Since calculated t = 2,187 and is greater than tabular t0.025,18 = 2.101 for one-sided alpha = 0.025 , we conclude that the mean tension bond strengths of the two formulations of cement mortar are different!
Conslusion
Since calculated t = 2,187 and is greater than tabular t0.025,18 = 2.101 for one-sided alpha = 0.025, we conclude that the mean tension bond strengths of the two formulations of cement mortar are different!
Further Reading
Introduction to QLazDOE software
DOE Case Studies
QLazDOE FREE Application


