What is QTrendControl?
QTrendControl is software for statistical analysis and trending of inspection results, being gathered in various industries and institutions. Typical examples are:
- Physical and chemical analysis of raw materials, packaging materials, bulk and finished products (pharmaceutical, diary, cosmetics, food & beverage and similar process industries)
- Physical, chemical and microbiological inspections of industrial utilities, such as purified water, compressed air, nitrogen, clean steam etc.
- clean-room conditions monitoring (air pressure, air velocity, humidity, temperature etc.)
- in-process quality control parameters
- defects and defectives counting


Why QTrendControl?
Various quality management and process improvement methodologies based on statistical approach, are already widely present in industries. Terms such as PAT (Process Analytical Technology), SPC (Statistical Process Control) or Six Sigma are not unknown in modern companies. However, companies rarely succeed in implementation of such methodologies, mostly due to lack of consistent approach and managerial vision to support such effort.
Additional important reasons why quality improvement programs often fail are:
- Data is collected, stored and distributed in unstructured and inconsistent manner.
There is huge inter departmental variability in procedures, mediums and approaches how to manage inspection master data and inspection records. - Compartmentalized and conflicting interests and perspectives.
For example, microbiological sampling of contact surfaces, clean-room areas or purified water is usually performed by laboratory staff, who are also responsible to conduct laboratory analysis and report results to respective department (e.g. Manufacturing or Maintenance & Energetics departments). Since standard operating procedures for sampling and analysis of microbiological inspections are normally written by Microbiological laboratory staff, such procedures tend to be adjusted to effective and easy sampling and reporting to respective department. For example, from laboratory employees perspective, it is most effective to conduct all kind of sampling in a manufacturing facility all at once. Typically, laboratory technician would take samples of swabs of contact surfaces and workers hands, rinses of pipes and hoses, settle plates, biofilm air samples etc. all at the same visit to a manufacturing plant. Since all these samples are taken from the same plant at once, it seems logically to report analytical results in the same report document, being delivered to the manufacturing plant. Thus, data about various inspection types, various equipment, facilities and utilities and inspection points are all mixed together on the same piece of paper.
While sampling and analysis is responsibility of Microbiological department, trending of such results is in most cases responsibility of the respective host department being owner of processes and equipment being controlled. For example, Manufacturing department is held responsible to prepare trends of microbiological results of equipment surfaces, worker hands and environmental conditions in clean-rooms. Similarly, Maintenance department is expected to prepare statistical and graphical trend on results of utilities, such as compressed and purified water. In both cases, employees expected to prepare such statistics and charts are confronted with a huge problem that data has been collected in a manner that does not facilitate statistical approach. Prior being able to produce any seamless report, such engineer first needs to restructure and prepare data. In typical scenario, this means manual copying/typing values for each inspection point into a spreadsheet. Obviously, this is time-consuming effort that also increases possibility of introducing errors. - Data is processed and reported in inconsistent way
Since multiple departments and stakeholders are responsible for reporting and trending of various inspection data, it is not unusual to see that each department or even professional inside the same department, has its own approach. Therefore, quality of such data greatly varies. - Statistical software fails to deliver value.
Although there are multitude of statistical software out there, investment in such tools often fails to deliver value to company. Some of the reasons are:- Statistical programs are often too difficult to comprehend for regular users who are not mathematicians by invocation. Companies often don't have employees possessing special expertise to be able to adequately utilize such software.
- Since data is not collected in efficient and structured way, it is not ready to be processed in the statistical software. Typically, data has first to be preprocessed and standardized and then manually imported into the software. Again, this implies huge effort, expertise and is prone to errors and inefficient.
Our conviction is that there is a need for software tool that would provide means for overcoming obstacles towards successful implementation of continuous process and quality improvement programs in manufacturing and quality oriented organizations streaming to excellence and cost reduction.
Motivation
Our motivation for creating QTrendControl has been vision of providing robust software tool that would enhance manufacturing, quality assurance and quality control professionals and organizations. Our main goals have been:
- To provide robust and integrated storage for both master data and inspection data, capable of storing and processing huge amounts of data
- Role based model of assigning users to user groups to perform: system administration, master data management, inspection data input, inspection data correction, inspection data reporting
- To provide integrated audit trail of each insert, update and delete of data
- To provide fast, rich and user friendly graphical user interface, with powerful search and filtering capabilities
- To manage organization structure and inspection matrix master data in a hierarchical and logical manner (organization-->department-->plant-->area-->line-->device-->inspection type-->inspection point)
- To enable definition of multiple inspection parameters for each inspection point
- To support both variable (continuous) data and attribute (discrete) data
- To support various data types (integer, decimal, textual, categorical)
- To distinguish between various types of requirements, such as limits and exact requirements
- To enable linkage of inspection results to hierarchical organizational elements as well as linking to products, batches, lots and samples
- To utilize templates for speeding up: inspection parameters definition, inspection data input, reporting of inspection results
- To enable flexible and super fast way of inspection data input according to predefined inspection matrix
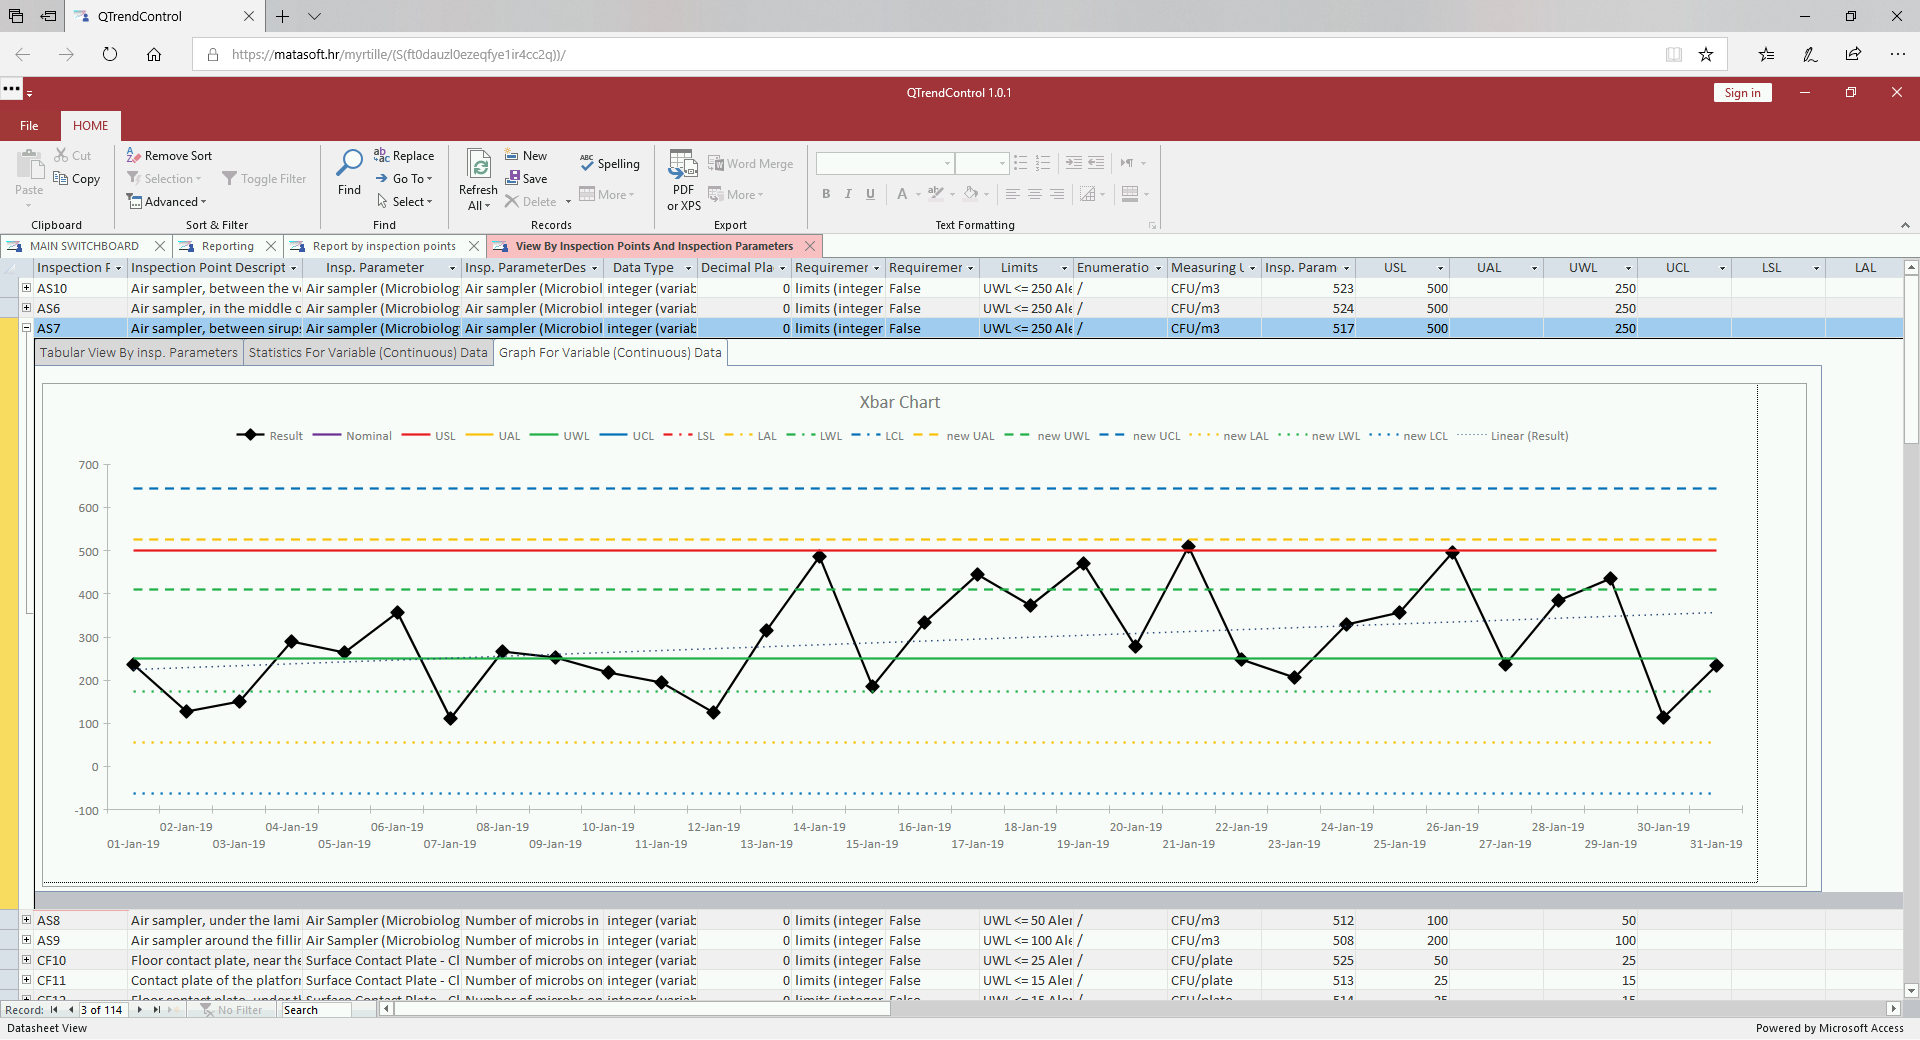
- To enable powerful forms and reports for statistical and graphical analysis of inspection results, utilizing following quality management and process improvement principles and methodologies:
- Control charts
- Six Sigma
- SPC (Statistical Process Control)
- PAT (Process Analytical Technology)
- Process capability calculation
- To provide data source for further advanced pivoting in spreadsheet software and analysis in statistical programs
- To provide technological basis for integration with internal and external IT systems (both inbound and outbound), such as:
- LIMS
- ERP
- MES
- SCADA
- BMS
We are convinced that our QTrendControl fullfills this mission in great extent and that you will find it to be great tool for providing you insight into your processes and enhance you to improve them.

Our moto is: MEASURE, TREND, IMPROVE!

Discover More
Visit our website to learn more about QTrendControl and how it can transform your operations. Contact us to schedule a demo and see the difference for yourself.
#QTrendControl #DataDriven #IndustrialSoftware #TrendAnalysis #Monitoring #ProcessOptimization #QualityControl #PredictiveMaintenance #EnergyEfficiency #ProcessImprovement #ProcessCapability #ProcessPerformance #ProcessMonitoring #ProcessTrending
https://matasoft.hr/QTrendControl/index.php/qtrendcontrol-software
https://matasoft.hr/QTrendControl/index.php/qtrendcontrol-software/20-trendcontrol-software/features
https://matasoft.hr/QTrendControl/index.php/qtrendcontrol-software/introduction
https://matasoft.hr/QTrendControl/index.php/qtrendcontrol-software/system-architecture
https://matasoft.hr/QTrendControl/index.php/qtrendcontrol-software/master-data-management
https://matasoft.hr/QTrendControl/index.php/qtrendcontrol-software/inspection-data-input
https://matasoft.hr/QTrendControl/index.php/qtrendcontrol-software/inspection-results-reporting
https://matasoft.hr/QTrendControl/index.php/qtrendcontrol-software/qtrendcontrol-demo
https://matasoft.hr/QTrendControl/index.php/qdoe-design-of-experiments-software/about-qdoe-software
https://matasoft.hr/QTrendControl/index.php/qdoe-design-of-experiments-software/doe-case-studies