- Details
- Written by Super User
- Category: Features
What is QTrendControl?
QTrendControl is software tool for statistical analysis and trending of inspection results, for purpose of continuous process improvement. It is based on principles of quality management and improvement methodologies such as SPC, PAT and Six Sigma. Typical examples of inspections are:
- Physical and chemical analysis of raw materials, packaging materials, bulk and finished products (pharmaceutical, diary, cosmetics, food & beverage and similar process industries)
- Physical, chemical and microbiological inspections of industrial utilities, such as purified water, compressed air, nitrogen, clean steam etc.
- clean-room conditions monitoring (air pressure, air velocity, humidity, temperature etc.)
- in-process quality control parameters in manufacturing process
- defects and defectives counting
In this article, we will present major features implemented in the program.
Main Menu
Upon successful login to database server, main menu dashboard is opened.


Master Data and Settings
Organization Structure and Inspection Matrix
By clicking on the button "Organization Structure and Inspection Matrix" you can open form for managing master data.


Users assigned to role "data_reading" can view master data, but only users assigned to role "master_data_admin" can insert, edit and delete data.
Form consists of several tabs:
- Tabs related to Organization Structure
- Organization
- Departments, Plants and Areas
- Lines and Devices
- Inspection Points and Inspection Parameters
- Inspection Types and Inspection Parameters Templates
- Product Catalogue
Organization Structure
QTrendControl enforces hierarchical definition of organization elements and inspection points related to organizational elements.
When defining inspection matrix, you need to follow following workflow: Organization-->Department-->Plant-->Area--->Line-->Device-->Inspection Point-->Inspection Parameter.
Each of the nodes in this flow is mandatory to be defined. However, you can leave some nodes with blank or dummy names. For example, if you don't have production lines and device for certain production area, you might name Line and Device "None", "Dummy" or just leave blank name and assign all inspection points for the area to this blank line and device item.
Keep in mind that this tabs are in hieararchical relationship - if you, for example, click on the tab "Lines and Devices", only record belonging to currently selected Organization, Department, Plant and Area in previous tabs will be shown.
Organization
In the Organization tab, you can define general info about your company or institution.

Note that in each organizational node, you have three check boxes: "Reporting?", "Input?" and "Active"

If "Reporting?" is checked, then this node will be available for selection criteria for generating reports. If "Input" is checked, then new inspection data entering is enabled for this organizational element. Option "Active?" is used to enable or disable certain organizational element for both reporting and new inspections input.
Departments, Plants and Areas
In this tab you can proceed with definition of departments, plants and areas for the currently selected organization.

Lines and Devices
In this tab you can proceed with definition of lines and devices for the currently selected area (area is selected in previous tab). Terms "Line" and "Device" are here used in most general sense. In most cases, line will designate a production line consisting of several devices, i.e. machines. However, line can also mean a facility or utility system, for example purified water or clean steam facility. It can also designate a group of laboratory equipment, e.g. several HPLC devices connected to the same LIMS system, etc.

As already discussed, if you don't have production lines and devices in certain area, or you wish to assign all inspection point directly to an area rather than to production lines and device, then you have to define "dummy" transitional line and device (e.g. "All lines", "None", "All" etc.).
Inspection Points and Inspection Parameters
In this tab you can define inspection points and respective inspection parameters, for the currently selected device (device selected in previous tab).

Each inspection point is associated with an inspection type, which can be chosen from a combo box list. Off course, you must first define inspection types, which is a prerequisite for definition of inspection points.

Each inspection point can contain one or more inspection parameters, which you can insert manually or using predefined templates. If you need to define multiple inspection points of the same type, you are advised to utilize templates. By using templates for inspection types, you can greatly increase speed of inspection matrix definition, because you don't need to configure manually each parameter all over again.

Scroll the inspection parameters subform to see all available columns, there are many of them and they don't fit on one screen.


Inspection Types and Inspection Parameters Templates
In this tab you can define Inspection Types to be associated with inspection points, as well as related templates to be reused when defining inspection parameters in the inspection matrix.

Product Catalog
Product catalog is an optional feature, it is not mandatory to be filled. If you, however enter products, you will be available to use it as one of the selection criteria in reporting.

Settings
If you click on the button "Settings", application will open form for managing lookup tables essential for QTrendControl functioning. Only user who is member of system_admin role can edit these tables. This form is to be used only for language localization purpose.


In this form, system administrator can localize: data types, requirement types, limit types, limit kinds, time units, organization elements for selection criteria in reporting and organization elements used for data input. He can also edit list of clean-room classes.


Input and Correction of Inspection Results
Input of Inspection Results
If you click the button "Input of Inspection Results", application will open form for inspection results input. Only users who belong to data_input role can enter new inspections into the database.


Form has two main tabs: "Enter inspection results" and "Templates for inspection results input".

Tab "Enter inspection results" has two sub-tabs:

By default, "Define And Generate Input Form" is opened.
On this screen user can define parameters to be used for dynamic generation of actual data input form.
There are two basic approaches to generation of data input form: ad hoc and template-base approaches.
a) Ad-hoc approach
This approach enables user to flexibly define organizational elements and selection criteria to be used for input data form generation. By default, all organizational elements are available for selection criteria.

You can choose an organizational element to be used for data input form generation, on each of the organizational structure level: department, plant, area, line, device, inspection type and inspection point.
Notice that organizational elements are in hierarchical relationship: Department-->Plant-->Area-->Line-->Device-->Inspection Point. If you leave superior hierarchy level empty, then all subordinated level elements are available. If you select an element on a superior level, then all subordinated levels are filtered and constrained only to elements belonging to the chosen superior element.
For example, if we leave Departments combobox blank and click on the Plant combobox, we will be able to choose between all plants.

If we first choose a department in the Department combobox, then llist of available plants will be constrained only to plants belonging to the chosen department.

The same principle applies to all comboboxes.
Define your selection criteria and then click on the button "Generate Data Input Form".


This will generate new data input form in the tab "Enter Inspection Results (Data Input Form).

You can repeat this process of data input form generation and prepare multiple data input forms ready for inspections data input later on.
Each generated data input form consist of inspection header and inspection details sections.
Inspection Header section
In inspection header section you can enter general inspection information applicable to all inspection points being inspected in this inspection.

There are three datetime fields available: Inspection Datetime, Analysis Datetime and Reporting Datetime. By default, all three are set to current datetime when form was generated, but you can manually change those values.

If you have defined product catalogue, you can also select a product and associate inspection to a product.

Further on, you can specify batch and lot, as well as collective sample mark.

Notice that you can define sample designation in both inspection header and inspection details section. You might use header sample designation for collective sample and details sample designation for individually taken samples.
Use button "Save" to save header content. Notice that this does not enter the inspection into database, this button just stores inspection header in temporary storage. In order to permanently enter inspection into database, we use button "Confirm Inspection Input", which will be explained later.

Inspection Details section
In the details section of Data Input Form, we can enter results and comments for each inspection point, i.e. inspection parameters for each inspection point.

Notice that the details section is a spreadsheet-like datatsheet with two levels. First level is related to inspection point, while second level (sub-datasheet) lists dependent inspection parameters.

Also, notice that the application immediately signals if entered result violates requirement or limit defined in the inspection matrix, by coloring result field yellow. Program immediately checks or unchecks "O.K.?" column and counts explicit requirements or limits violations. For example, you migh have multiple limits defined in the inspection matrix (e.g. warning limit, action limit...), so you will immediately see how many limits are violated.
Scroll the details sheet to right and notice that there are three columns for entering information about taken samples.

Finish results input for all inspection parameters and go back to the header section. Now we can confirm inspection results input by clicking button "Confirm inspection input". This will trigger procedure that enters inspection into the database and records it in audit trail.


b) Template-based approach
Template based approach utilizes templates to speed up process of data input form generation. Notice templates list on the left side of the form, where you can choose available templates.

If you click button "Apply Input Data Template", only organizational elements enumerated inside the template will be available for selection.


If you click button "Input Data Template", all selection criteria comboboxes will be shown again.


Templates for Inspection Results Input
Templates for Inspection Results Input can be defined in the respective tab.

Correction of Entered Inspection Results
Once inspection is confirmed, data is transferred permanently into the underlying database and it is recorded in the audit trail. Data input form is then deleted automatically.
User who was entering inspection data made a mistake, can not revert it back, unless member of data_correction role. Only users belonging to data_correction group can correct mistakes made during inspection data input.
Note, however, that any such change is transparently recorded in the audit trail.
You can access Data Correction form by clicking "Correction of Entered Results" button.


Reporting of Inspection Results
Inspection results reporting in structured way with included statistical analysis and control charts is the main purpose of the QTrend software.
You can open reporting form by clicking on the "Report of Inspection Results" button.


Grouping and selection criteria
Here again, similarly to inspection data input, we can take two approaches to define selection and grouping criteria: ad-hoc approach and template-based approach.
First, to clarify what we mean by "grouping criteria" and "selection criteria".
When creating printable reports, beside extensive statistics being performed on inspection points and inspection parameters level, we can also get basic statistics on a hierarchy level groupings. By hierarchy levels, we consider organizational hierarchy nodes (organization-->department-->plant-->area-->line-->device-->inspection type-->inspection point).
By "grouping criteria" we mean which organizational hierarchy nodes will be included in the report as group headers with basic statistics.

Term "selection criteria" designates selected organizational entities for each organizational hierarchy node.

a) Ad-hoc approach
By default, all organizational hierarchies are available for grouping and selection. Also, when you open the form, by default all organizational entities on all hierarchy levels are selected for reporting. The application however enables you to manually define which organizational entities will be included, providing you multi-selection lists for each organizational node.
Sub-tabs of the "selection criteria" tab list available organizational entities for each organizational node. Note that these lists are in hierarchical relationship (departments-->plants-->areas-->lines-->devices-->inspection types-->inspection points). When you select some items in an superior hierarchy level, this will determine which subordinated items will be shown and be available for selection. This gives you flexible means of fine-grained selection of organizational entities to be included in reporting. For example, let's say that we want to report inspection results for all inspection points belonging to SI-01LF area for production of sirups. We would constrain selection criteria this way:


If you defined product catalog and entered batch, lot or sample information in inspection header, then you can also use these optional additional selection criteria as well.

b) Template-based approach
Similarly to templates used for data inspection input, there is possibility to define templates for reporting and then use it to speed up reports generation.

If you click "Apply Reporting Template" button, two things will happen: Grouping criteria will be constrained to only those organizational nodes listed in the template and in the selection criteria tab you will be bale to select items only in those organizational hierarchy nodes.


If we click the button "" then all grouping and selection criteria nodes are available again.


Templates for results reporting
You can define your reporting templates for various repetitive tasks, in the tab "Templates for results reporting".

Start and End Date Criteria
You can enter start and end date of time period for which you wish to report.
In this example, date format is: d.M.yyyy. Preffered date and decimal point format is configurable for each remote desktop user, according to customer preferences.

Available Reporting Options
QTrendControl offers several reporting types for presenting inspection results.

Report by inspection points
Report by inspection points is a printable hierarchical, banded report structered in hierarchical manner.
View by inspection points
View by inspection points is a hierarchical datasheet/sub-datasheet form with tabular, statistical and charting details. Inspection point parameters are in master datasheet, while inspections are in sub-datasheet.
Flat view
Flat view is two-dimensional spreadsheet-like flat datasheet, suitable for exporting into Excel for further advanced analysis and pivoting.
Report by inspections
Report by inspections is a hierarchical datasheet/sub-datasheet form where inspections are in master datasheet, while inspection points are in sub-datasheet.
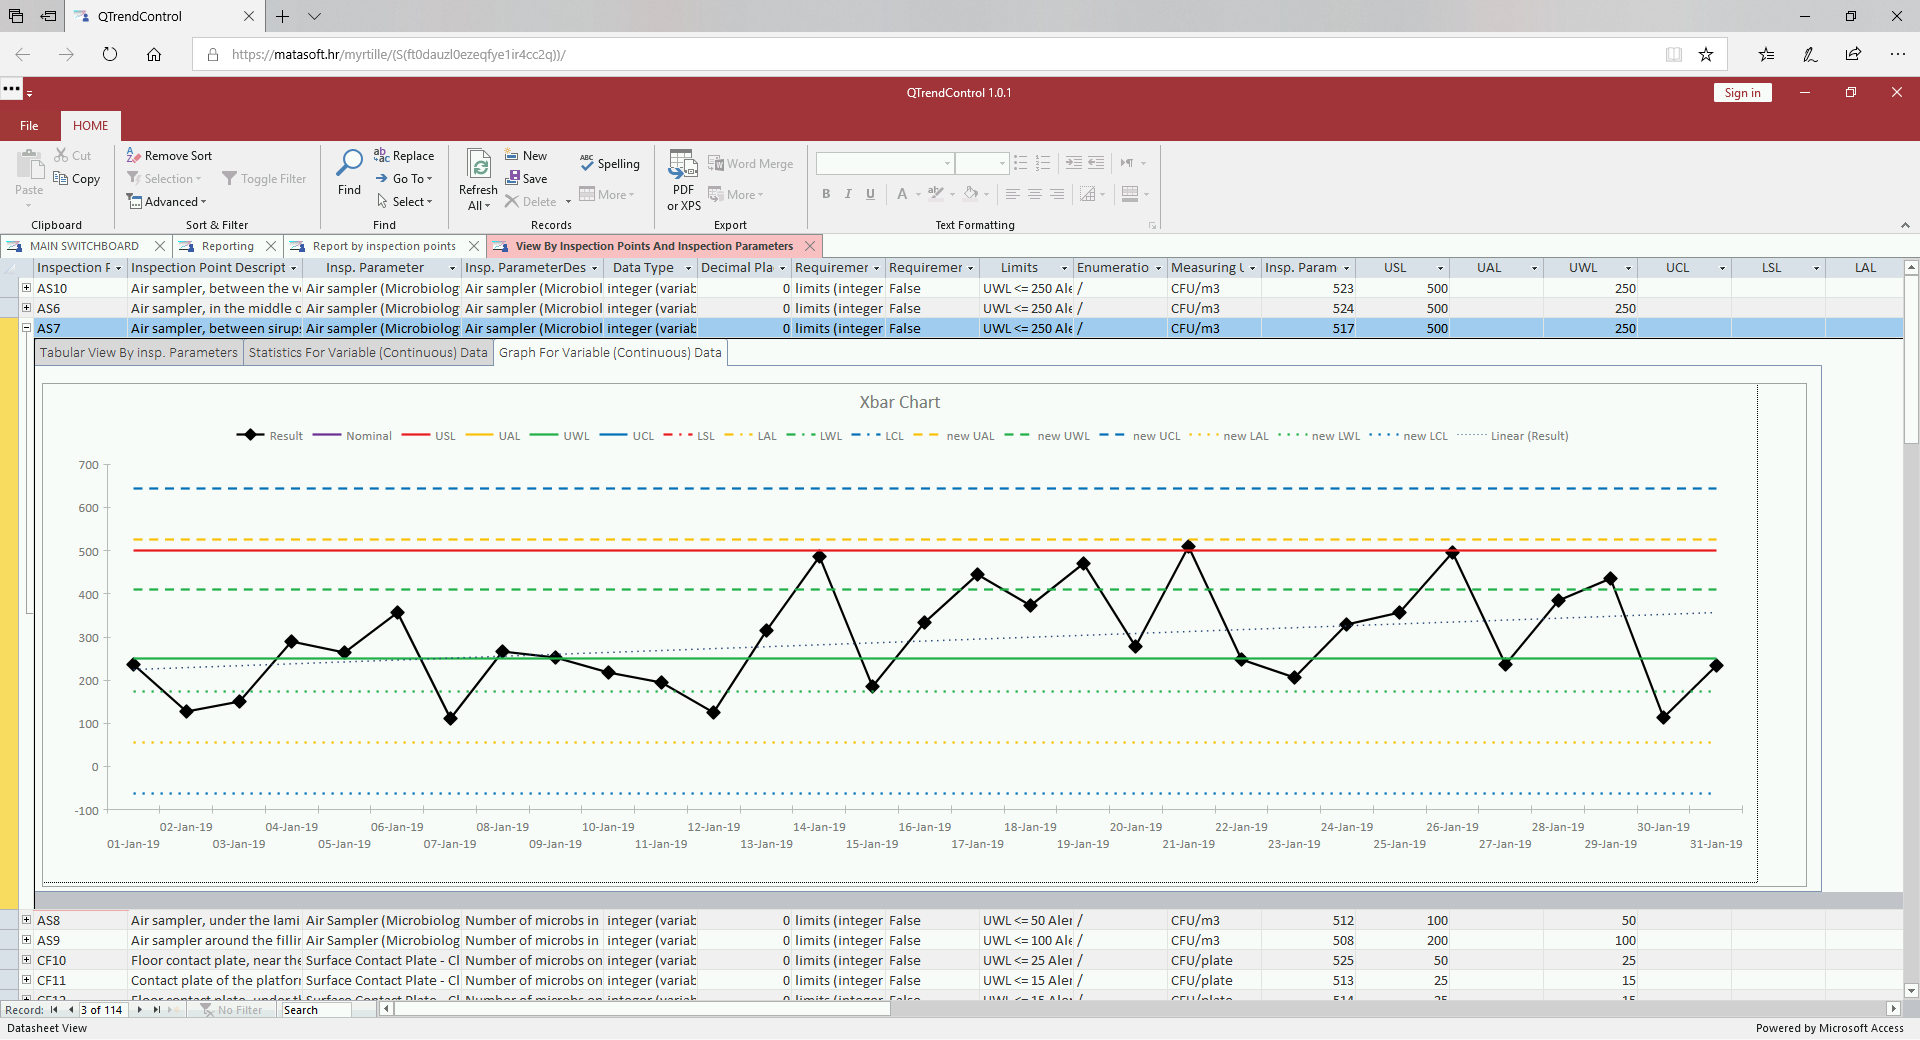
View of Inspection Results by Inspection Points
Let's now set our selection criteria and report on inspection results. In our demo database we have randomly generated some demo data for production of syrups and production of hard gelatine capsules. Syrups have various variable (continuous) data inspection parameters, while hard gelatine capsules have some defects counting inspection parameters (attributes i.e. discrete type of data).


If you click the button "Open View, By Inspection Points", this will trigger generation of form for browsing and viewing of inspection results with included statistical analysis and control charts. Depending on the selection and date criteria, this can take more or less time to complete.


We can now dig into the details for each inspection point (expand an item by clicking small plus sign), where you can choose between tabular view, statistic or control charts (graph).
An example for variable (continuous) data inspection parameters:


An example for attribute data (discrete data) inspection parameters:


Notice that on the upper part of the screen, you have Microsoft Access ribbon, which provides tools for advanced sorting, filtering and searching.

You can also customize your columns width, freeze/unfreeze columns and hide/unhide columns.


Printable Report of Inspection Results by Inspection Points
If you wish to create printable report, you can do it by clicking on the button "Open Report, By Inspection Points". Generation and formatting of a report can take more or less time, depending on the selection criteria and chosen time period.


First few pages present and compare what selection criteria was used and what organizational elements QTrendControl actually found in data.

Report is structured in hierarchical way, having groups by organizational nodes (department-->plant-->area-->line-->device-->inspection type-->inspection point-->inspection parameter). Only hierarchies chosen in the grouping criteria (by using templates) are shown. On each node, basic statistics is shown. For example:

Finally we come to inspection points.

For each inspection point, one by one, we see data for each inspection parameter.
First we can see tabular data.

Then, basic and descriptive statistics. Actual look of this section depends whether data is variable (continuous) data or attribute (discrete) data, whether distribution is normal or non-normal etc.

It is followed by new limits proposal calculation and process capability calculation. Again, this screen can look differently depending on whether data is variable or attribute data and depending on the type of data distribution.

Finally, we come to control chart graph.

Report can be saved locally on your computer as PDF file or directly printed on your local computer by using Myrtille PDF printer.


Flat Datasheet View of Inspection Results by Inspection Points
Flat datasheet view, as name suggests report data in two-dimensional spreadsheet-like format that can be used for advanced analytics. You might, for example:
- use filtering and searching capabilities of Microsoft Access ribbon to explore the data in details
- export datasheet to a spreadsheet software like Excel or LibreOffice Calc where you can create custom pivot tables and charts
- export datasheet to specialized statistical software
Click on the button "Open Flat View".


Pivoting in Spreadsheet Software
Select all rows and click "Copy" button on the ribbon.

Now, notice and click small button with three dots, placed in upper left corner of screen. This will reveal Myrtille ribbon with various options concerning handling remote desktop connection.
Click on the "Clipboard" button.


Now, click "CTRL+C" on your keyboard and paste it into a spreadsheet software and create pivot table.
For example:

View of Inspection Results by Inspections
In comparison to previously explained reports and views based on presenting data based on inspection parameters, this view presents data based on inspection headers (i.e. inspections), exactly as inspections were entered through inspection data input form.

Management of Users and Roles
QTrendControl provides interface for system admin user to manage users and assign them to appropriate roles.

QTrendControl role based model is simple and straightforward. Following roles (i.e. user groups) are predefined in the system:
1. data_reading role
All users are by default assigned to this role, which enables reading of all data.
1. data_input role
This role enable users to insert new inspection data into database.
1. data_correction role
This role enables users to correct mistakes in previously entered inspection data.
1. master_data_admin role
This role enables users to insert, update and delete organizational structure and inspection matrix.
1. system_admin role
This role enables user to edit lookup tables (i.e. application settings) and manage users and roles.
Managing Users

Managing Roles

Audit Trail
QTrendControl automatically records all inserts, updates and deletion on data, along with timestamp and information who did what.
Audit trail can be explored (read only) in a separate form.

Internationalization
QTrendControl provides localization of user interface to local language, through translation form. (Currently, English and Croatian/Serbian languages are available).


You can switch to desired language by clicking "Select language" button. This language is available on the Main menu dashboard, as well on the server login form. Closing and reopening of the application is required, in order to apply changes to the main form too.
System Architecture
QTrendControl is client/server type of application, deployed to clients as a cloud-based web application.
Data is stored in robust PostgreSQL database server, ensuring huge storage capacity, data integrity and scalability, along with included audit trail functionality.
Front-end application is based on Microsoft Access, ensuring rich and user-friendly graphical user interface with high level of interactivity, advanced filtering and searching capabilities.
Front-end application is deployed as web application through web browser remote desktop sessions, thanks to great open-source project called "Myrtille" (https://cedrozor.github.io/myrtille/).
Final Thoughts
We hope that this features overview introduction was informative enough to give you idea what QTrendControl is all about and what it offers to you. Our intention has been to create powerful yet intuitive and straightforward tool to enhance you in continuous quality improvement efforts. You tell us whether we succeeded or not! Please, send us your comments, critics and ideas for improvement.
We will gradually add new, more detailed content on our web site, please check it periodically.
You are also invited to actively experiment with our demo system (check it here: QTrendControl Demo Application).

Discover More
Visit our website to learn more about QTrendControl and how it can transform your operations. Contact us to schedule a demo and see the difference for yourself.
#QTrendControl #DataDriven #IndustrialSoftware #TrendAnalysis #Monitoring #ProcessOptimization #QualityControl #PredictiveMaintenance #EnergyEfficiency #ProcessImprovement #ProcessCapability #ProcessPerformance #ProcessMonitoring #ProcessTrending
https://matasoft.hr/QTrendControl/index.php/qtrendcontrol-software
https://matasoft.hr/QTrendControl/index.php/qtrendcontrol-software/20-trendcontrol-software/features
https://matasoft.hr/QTrendControl/index.php/qtrendcontrol-software/introduction
https://matasoft.hr/QTrendControl/index.php/qtrendcontrol-software/system-architecture
https://matasoft.hr/QTrendControl/index.php/qtrendcontrol-software/master-data-management
https://matasoft.hr/QTrendControl/index.php/qtrendcontrol-software/inspection-data-input
https://matasoft.hr/QTrendControl/index.php/qtrendcontrol-software/inspection-results-reporting
https://matasoft.hr/QTrendControl/index.php/qtrendcontrol-software/qtrendcontrol-demo
https://matasoft.hr/QTrendControl/index.php/qdoe-design-of-experiments-software/about-qdoe-software
https://matasoft.hr/QTrendControl/index.php/qdoe-design-of-experiments-software/doe-case-studies
- You are here:
-
Home

-
QTrendControl Software
-
QTrendControl Software
- Features